By York Baur, CEO MoxiWorks
As we close out the second quarter of 2020, there remains a lot of uncertainty in the still very prevalent COVID-19 world. Looking back on the last few months though, the real estate industry has pivoted more rapidly than most expected.
We’ve been analyzing the market data closely, waiting to see if there’s another shoe to drop. But, through this whole experience, even when we were at the peak of new COVID-19 cases, we continued to see agents staying in touch with their spheres and people buying and selling homes across the country. This gave us confidence that no matter what happens, homes will continue to transact.
And, while we’re not out of the woods yet, with several cities and states beginning to see another rise in cases, I’m still bullish about the recovery of our industry as we enter the second half of 2020.
The current landscape
We believe in being transparent and honest with our fellow Moxians and have been reviewing market data with the company every week during our company-wide town hall meetings. We want to make sure our entire company has insight into how the real estate market is doing, and what we can be doing to help. While we still believe that no one can truly predict the outcome of this pandemic, there is a lot of data trending into the recovery, some of which is even surpassing data from the same time last year.
Pending Home Sales
In NAR’s most recent report (June 29, 2020) pending home sales spiked 44.3% in May compared to April. This is the highest month-over-month gain since NAR started their Pending Home Sales Index (PHSI) series in January 2001.
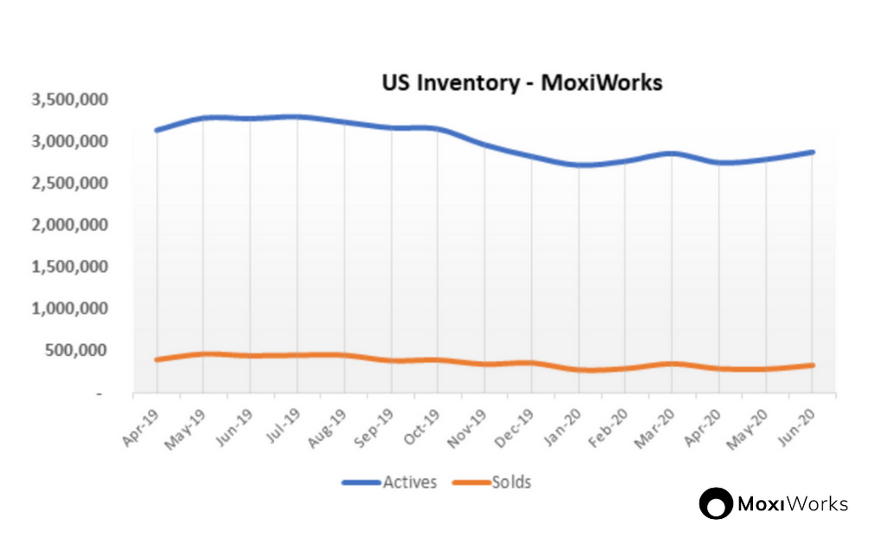
Our own data shows this same trend. We have over 95% of the US home sale footprint in our systems, allowing us to do additional analysis. For instance, inventory continues to be highly constrained – just take a look at what’s happened over the last year in the chart below – the normal Spring listing season was skipped this year due to the pandemic, and national inventory has been compressed substantially.
List Price
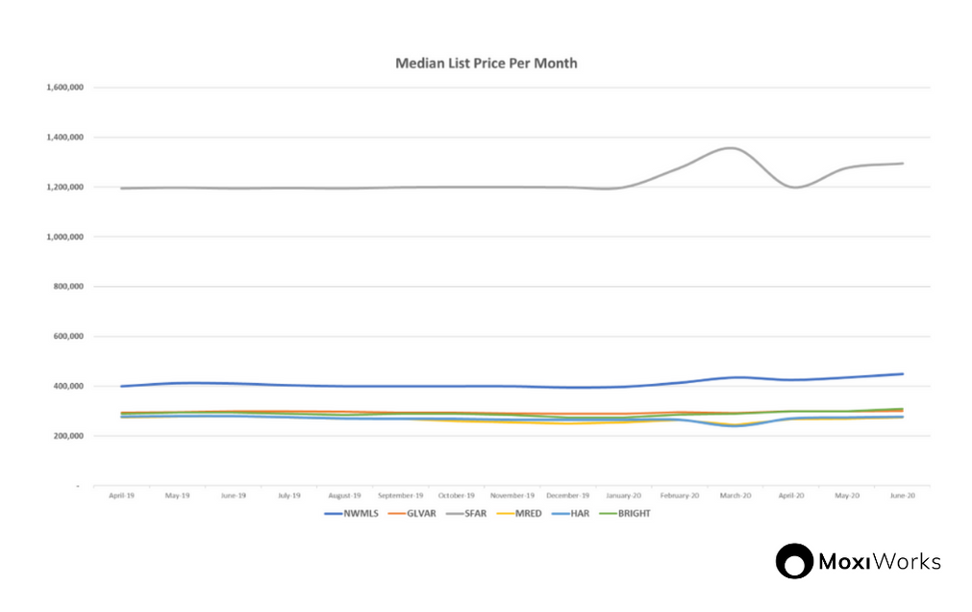
Given this low inventory combined with surprisingly good closings, the result is steady prices with even some upward pressure in certain markets. This is particularly true in tech-driven housing markets like San Francisco (grey line in the chart below) and Seattle (blue line), where pricing has been pushed up substantially due to lack of inventory.
Listings & Solds
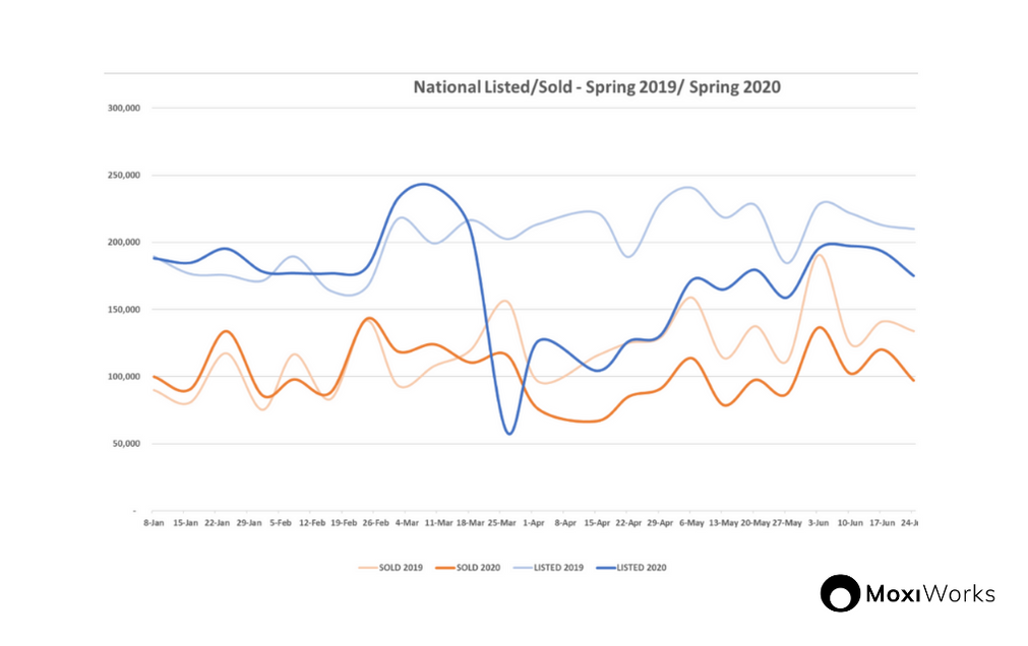
We’re seeing a continued trend up and to the right for new listings and solds in a given week, which is a great sign of the beginning of recovery. Overall, the year-over-year gap has narrowed, which is a hopeful sign of recovery. It’s also worth noting that following the massive dip at the start of the pandemic, the shape of both curves is following last years – another sign of some return to normalcy in the market.
National vs. Regional Data
One quick note on the data we’ve been reviewing. Because we are a national SaaS company, we tend to focus in on the national housing data, but I know it’s not always enough to just look at the national data, often it’s more pressing to pay close attention to the regional data on listings, pricing and solds. Mike DelPrete has created The Real Estate Market Tracker so you can do a deeper analysis of your regional data. I’m a big fan of Mike’s work – he’s worth following for his insights and analysis.
Leading Indicator: Agent Activity Remains Strong
Everything I’ve shown you in the paragraphs above are lagging indicators, in other words, stuff that’s already happened. It’s easy to fall into the trap of looking at lagging indicators like these and trying to predict the future, but that’s a mistake. Instead, we need to find leading indicators – activities that precede and lead to the outcomes shown above.
For us at MoxiWorks, the leading indicator we look at most closely is agent activity in our products. Our technology has always been about sphere-centricity, helping agents be good with the people they already know and to help them stay in flow with their sphere of influence. In spite of the industry’s obsession with leads, the reality is that the agents that command the vast majority of the transactions have their sphere of influence to thank as their primary source of business. Therefore, when agents use our CRM, presentation tool, and other products to interact with their sphere of influence, it’s a very accurate predictor of future business.
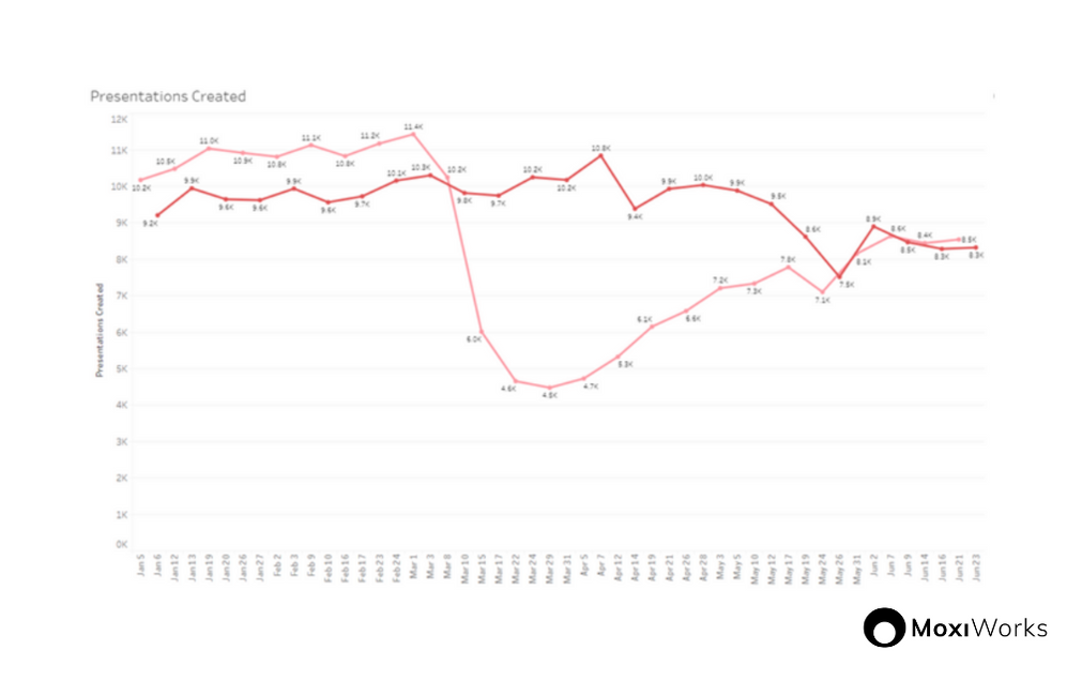
One of the best of these leading indicators for us comes from MoxiPresent, MoxiWorks’ presentation product. While it’s a general-purpose tool for presenting to consumers in many different ways, a primary use is for presenting seller presentations, or CMAs. Our historical analysis of this data shows that it’s a great predictor of new listing inventory 60 days from when the listing presentation is delivered to the homeowner.
At the end of June, the volume of MoxiPresent listing presentations created is almost the same as last year. So, while total inventory will take a while to even out, we’ve historically been able to predict the highs and lows of future transactions based on the number of MoxiPresent presentations being created. As you can see in the pink line in the chart below, seller presentations have recovered to last year’s levels after a severe dip at the beginning of the pandemic. This implies that there will be a rebound in new listing inventory in the coming 60 days – a great sign that there’s some relief for the tight inventory situation coming soon.
Additionally, when we look at product usage across all of our products year over year almost everything is increasing week over week and year over year even as we embark on month four of this global pandemic and uncertainty. All positive signs.
Where we go from here
When this all started at the beginning of March, we shared the three principles we planned to live by which were to: be optimistic, be supportive, be productive.
We’ve seen so much creativity, ingenuity, and positivity from the real estate industry and we are looking forward to seeing how the industry continues to hold steady, push forward and help our economy recovery in the months to come.


 Facebook
 X
X
 Pinterest
 Copy Link


